I use a Ventus G730 GPS route logger to record my bike rides. The device reads position and elevation from the GPS satellites; the data is stored internally in a binary format and this data can be extracted and converted to a human-readable XML format such as gpx. I use skytraq-datalogger on a linux computer to do this. The gpx files record position, elevation, time of day and speed throughout a ride, and may be uploaded to a mapping service such as http://bikeroutetoaster.com or http://bikehike.co.uk.
On the whole the positioning data is very good; only once on a ride in North Hampshire was I magically moved to a trackpoint in mid-Wales before returning immediately to the correct route. The error certainly made a huge difference to the distance covered on that ride! I put the problem down to a satellite wobble, or a blast of cosmic rays, but it could equally have been some local corruption on the GPS device, or my computer.
Elevation data is a different story. I want to record how much I climb and descend on my bike rides, but the elevation data seems much more unreliable than the positional data both in terms of the accuracy of the height according to the satellites, and in the frequency of transient errors.
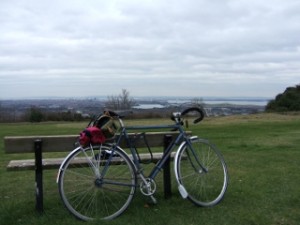
On a recent shopping trip I diverted to the 100m contour line at SU660065 (50.854N, 1.063W according to the Ordnance Survey), located on the ridge of Portsdown Hill overlooking the city of Portsmouth.
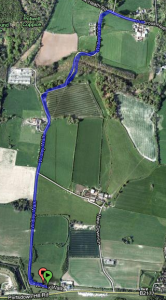
I cycled down the North side of the hill to the 40m contour line at SU665080 (OS say this is at 50.868N, 1.055W), which is by a corner in Purbrook Heath,
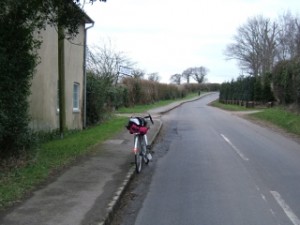
then I cycled back to the starting point.
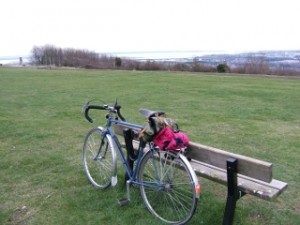
The GPS logger was switched on at the start where I left it for a little while to be sure it acquired a good signal, the time of day according to my watch was recorded. At the turning point I remembered to reset the trip odometer on my bicycle computer, and again recorded time of day before climbing back up the hill where I parked in the same place, noted time and distance, then switched off.
The results shown below are a mixture of good and bad … all the GPS values are taken directly from the gpx file derived from the satellite data. Times are rounded to the nearest minute (my watch wasn’t synchronised to GMT), latitude and longitude are rounded to 3 decimal places, altitude is rounded to the nearest metre. As contour lines are not marked on the road all the readings were taken at positions limited by my ability to read the 1:50000 map sufficiently accurately. If we accept the GPS locations as fairly accurate then the start, mid and finish positions do look sufficiently close to the contour lines for us to be able to assume the actual heights are as given on the OS map:
Start time (watch): 14h45
Start time (GPS): 14h45
Start location (OS): 50.854N, 1.063W
Start location (GPS): 50.854N 1.064W
Start elevation (OS): 100m
Start elevation (GPS): 142m
Mid time (watch): 14h57
Mid time (GPS): 14h55
Mid location (OS): 50.868N, 1.055W
Mid location (GPS): 50.868N, 1.056W
Mid elevation (OS): 40m
Mid elevation (GPS): 85m
Finish time (watch): 15h13
Finish time (GPS): 15h13
Finish location (OS): 50.854N, 1.063W
Finish location (GPS): 50.854N 1.064W
Finish elevation (OS): 100m
Finish elevation (GPS): 144m
There is clearly a problem with the GPS elevation data in the gpx file which seems to be around 44m higher than it should be. The only good news is that the error appears to be fairly consistent.
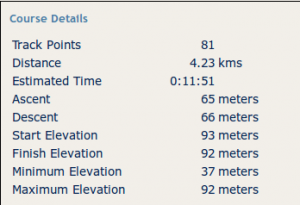
Distance mid-point to finish by bicycle computer was 2.28km, the GPS distance was obtained by uploading the gpx file to the two mapping services given above, both of which showed a total journey of 4.23km, suggesting that each half was about 2.12km.
Note that the elevation figures in the bikeroutetoaster statistics for the ride do not correspond with the numbers in the gpx file.
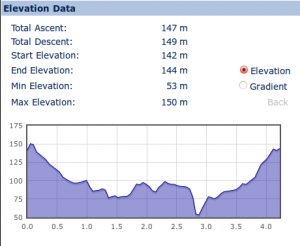
The bikehike figures on the other hand do correspond with the data in the uploaded file.
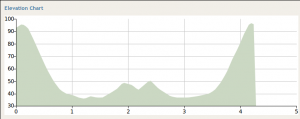
Given that the ride was out and back, we might expect to see a symmetrical profile for the ride, reflected around the 2.12km mark, however the asymmetry of the bikehike profile suggests there is a glitch in the elevation data in the gpx file.
The bikeroutetoaster profile is more symmetrical and the chasm shown at around 2.75km in the bikehike profile is absent in the bikeroutetoaster version.
The author wrote a very simple program that extracts the elevation data from the gpx file then for each trackpoint it determines if the change in height is up or down and adds the change to total ascent and descent accordingly. Significantly this program makes no attempt to filter out any erroneous data, it trusts that the given data is accurate. The results obtained when this program processed the gpx file are:
81 lines processed
Total ascent = 153 Total descent= 151
Max height = 150 Min height = 53
Initial height = 142 Final height = 144
The statistics from the home-brew program are tolerably close to the bikehike statistics, but both of these are some distance from the bikeroutetoaster figures. Inspection of the gpx file directly shows that at 50.864N, 1.062W at 14h52 the height is 78m, while at the same position at 15h04 the height is 53m. As I didn’t notice an earthquake we can conclude that at least one of these values is incorrect, and in fact the second (later) one seems erroneously low compared with the data on either side of it. There has clearly been some transient effect that has upset the recording of elevation in the original GPS data. Such errors clearly have a disastrous effect on any attempt to accumulate total ascent; in this case there is a phantom chasm, some 25m deep, to descend and climb.
The mystery remaining is why the bikeroutetoaster elevations, and totals for ascent and descent differ so markedly. Obviously it does not use the elevation data in the uploaded file. Google maps provide a service that relates position (latitude – longitude) to elevation anywhere on the Earth (including depth locations on the ocean floor) and it seems likely that bikeroutetoaster uses such a third party service to obtain elevation data which is more reliable than the data captured by GPS devices which often seems to be disrupted by variations due to entering buildings, etc.
So if my ride went from the 100m contour to the 40m contour and back, why does bikeroutetoaster show an ascent of 65m and descent of 66m? Well I have to admit that there was a slight defect in the experimental design because the 100m contour that I identified on the map was on the “wrong” side of a small rise. In fact the high point of the ride was on the first (and last) bend shown on the map above, about 20m from the start (and finish) point; so as well as the 60m between the contours I had this extra little lump to climb … twice, also there were some undulations on the way to Purbrook Heath adding to the total climb. So while bikeroutetoaster certainly gets top marks I can’t help but feel its numbers are little bit on the low side.
What I need is a hill that is several kilometres long and is all down (or up) with identifiable contour lines somewhere near the top and bottom. If you know of anything suitable please tell me in the comments to this post, or do the experiment yourself and let me know!
Conclusions
Altitude data derived from GPS is more unreliable than GPS positional data, this unreliability has been observed over many rides and is confirmed (but not explained) here. Such elevation errors seem to afflict the GPS devices of friends as well, so it seems unlikely that the fault lies in the Ventus G730 alone.
Altitude data is unreliable as an absolute measure, in this case the elevations were over 40m too high when compared with the known heights of the OS contour lines. Readings are also unreliable relative to one another due to transient effects such as shading by trees or buildings; on other occasions we have seen elevation going up and down while we have been sitting in a cafe enjoying a coffee. In today’s experiment there appears to have been a significant elevation recording error on the return half of the journey, possibly due to riding under trees.
For software attempting to calculate total ascent and descent, consistently high or low values are not a problem, but when errors cause the readings to fluctuate then the software will be recording the climbing and descending of many virtual mountains and chasms that do not exist in reality.
The bikehike software has an interface that is very easy to use, and includes some excellent features, particularly the way it makes it easy to relate the height on the profile to the position on the map; however the elevation data itself which comes directly from the file uploaded to the website is not to be trusted. Or putting it another way, the bikehike website is much too trusting of the accuracy of the data provided. It might be possible to devise some filters to help eliminate some of the errors, for example height should not be changing if latitude and longitude are unchanged (unless you are in a balloon, or a submarine); and it should be possible to set limits for maximum rates of ascent and descent when cycling, and eliminate any elevation changes that go outside these limits. Cleaning up the input file in this way should make measurement of total ascent more credible.
The bikeoutetoaster software adopts the radically different method of using a third party service to obtain elevation data that corresponds to the geographical position obtained from the file uploaded, thus the captured GPS elevation data is ignored. On the basis of several dozen rides uploaded to the website this does appear to give more reliable results.
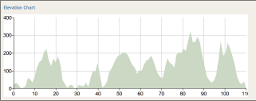
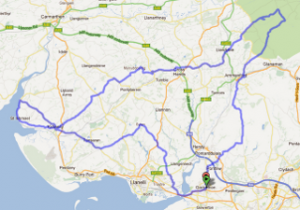
Whether bikeroutetoaster is good enough to meet the standards required to validate AAA (Audax Altitude Award) points is open to question. The author completed the Crwydrad Y Cestyll hilly audax in September 2011, which promised 2200m of climbing in the 111 km ride.
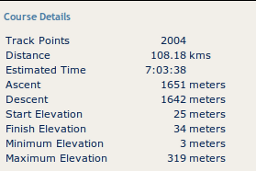 However bikeroutetoaster showed a total ascent of only 1651m. Given that AAA points are based on Ordnance Survey data, and are carefully checked, it seems likely that bikeroutetoaster is missing some elements of the climbs. So if we are looking for an automated way to obtain AAA values this software falls short.
“Garbage in garbage out” is an aphorism almost as old as the history of computers. We should all be very suspicious of the elevation values obtained from GPS satellites, and related statistics such as total ascent, or gradient of a hill. On the evidence so far such data would require considerable cleaning up before it might be suitable to give us a satisfactory estimate of total climbing during a ride. The google maps database of elevations, if it is accurate, seems a more reliable source of heights if only because it is not susceptible to strange fluctuations that can cause an elevation profile to look like a seismograph during an earthquake, with knock-on effects for measuring total ascent. However it seems there is still a software challenge for somebody to create a program that will process elevation data that is not garbage in order to produce a satisfactory total of ascent and descent.

This may be of interest – it is a short piece on the accuracy of GPS altitude readings.
http://weather.gladstonefamily.net/gps_elevation.html
Thanks very much for that link, and yep, it’s definitely of interest, and my head is still intact having read it! A leavening with
http://www.gpsu.co.uk/heights.html
also helped a bit. The explanation in the paper you cited, in terms of satellite configuration and the weaknesses in the software model built into commercial GPS seems quite convincing.
It seems to me that a small percentage error measuring height from the Earth’s centroid of mass will be a much larger error when we are measuring the difference in height of two points each of which has been measured with the error variability described. Also our use of these devices in practice often involves interference with satellite visibility through shielding by the user’s body, or by external objects such as trees, or the material of an enclosing bag or jacket, or the same material when soaking wet, or travelling through gorges, tunnels or buildings. Controlling for these factors is extraordinarily difficult.
I had some off-blog email correspondence which suggested that it may be beneficial to speed up the sampling rate of my device in order to give the algorithm a better chance of working out a decent average value for the height. I’ve done this, and need to gather some data to see if it’s made a difference. I’ll report here when I have more to say.